PM 2.5 - CSC 101 Final Project
Tuesday, March 10, 2026
PM2.5 Air Quality Analyzer
For our CSC 101 final project, we built a data-reporting tool that turns raw PM2.5 air quality readings into a clear, readable summary. The goal was to take CSV data and automatically produce meaningful insights —like averages, extremes, and health-standard exceedances — so it’s easier to understand air quality across different cities over time.
Dataset: PM2.5 readings (µg/m³) from September 2025 – January 2026 across:
- Los Angeles
- Mexicali
- Sacramento
What the program does
At a high level, the program:
- Loads one or more city CSV files
- Parses each row into a structured data record
- Builds a City object for each dataset
- Computes key statistics automatically
- Writes everything into a generated .txt report
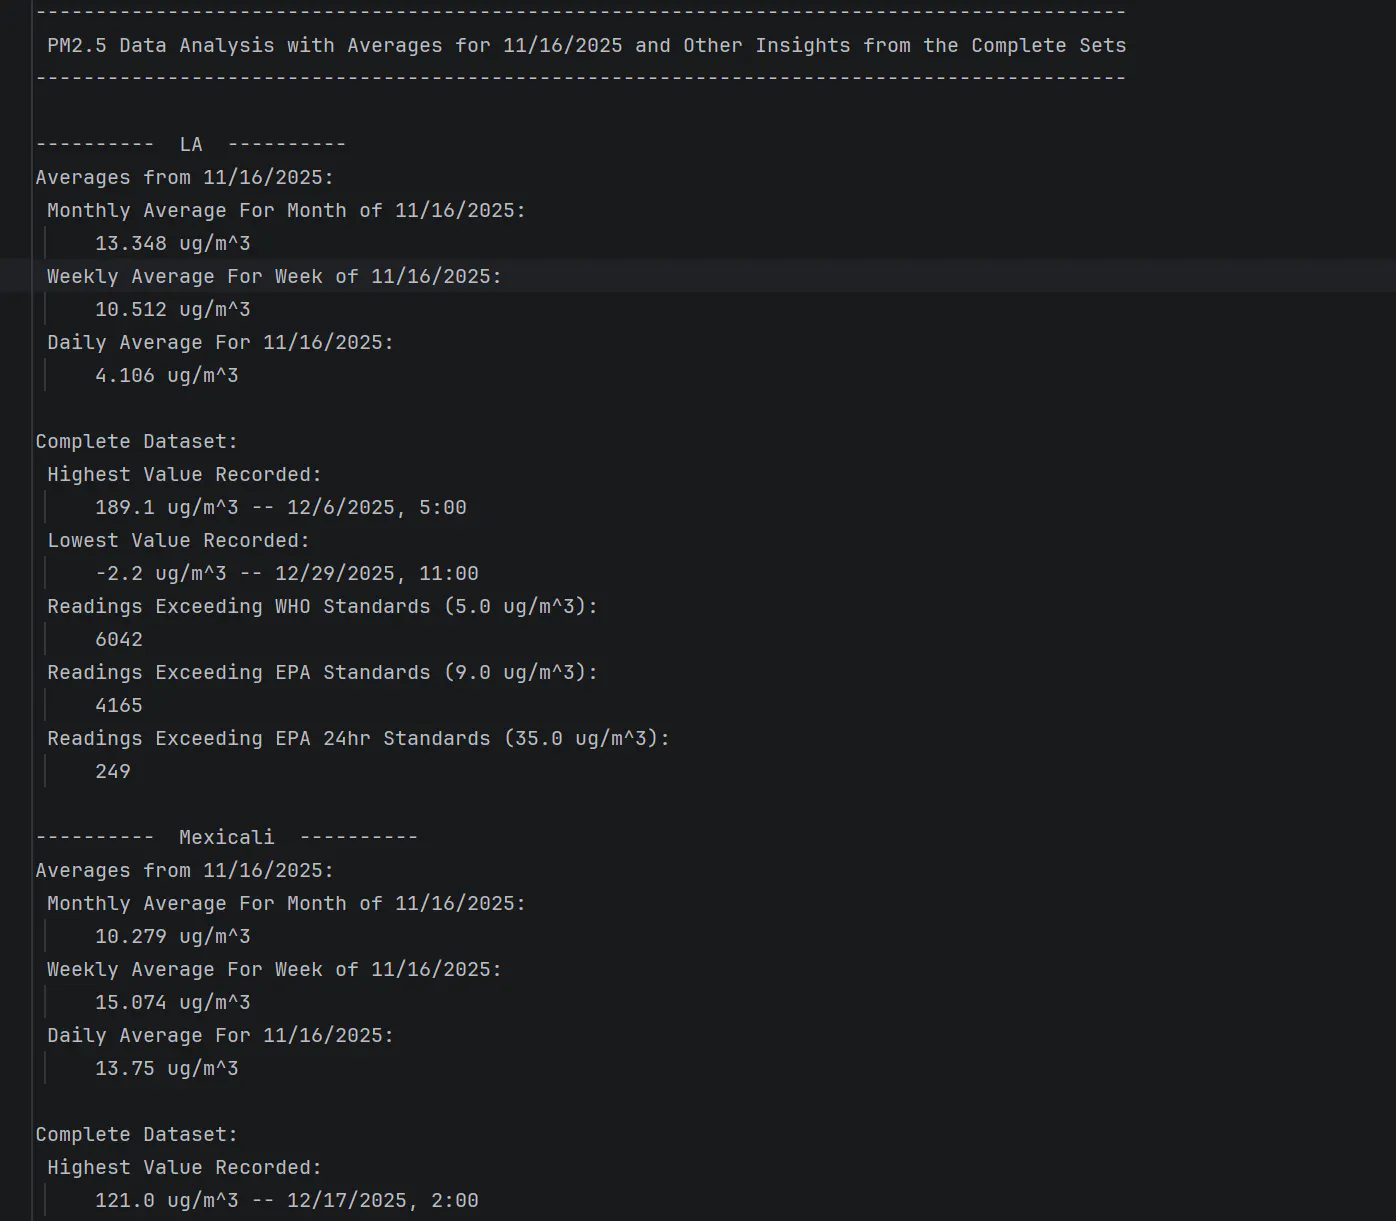
Key outputs include:
- Daily / weekly / monthly averages
- Highest and lowest PM2.5 readings (with timestamps)
- Days exceeding a health standard threshold
- A combined summary when multiple cities are included
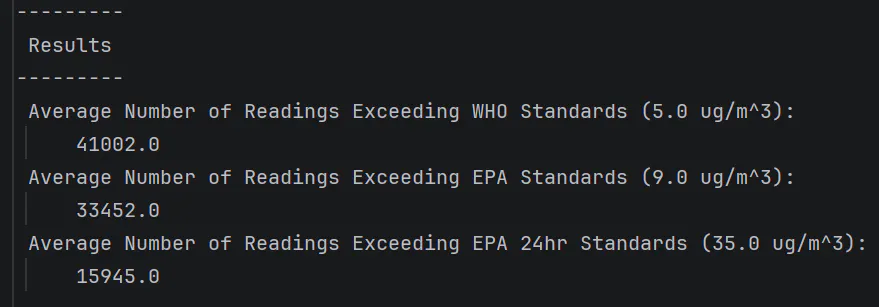
Sample Program Output:
How to run it
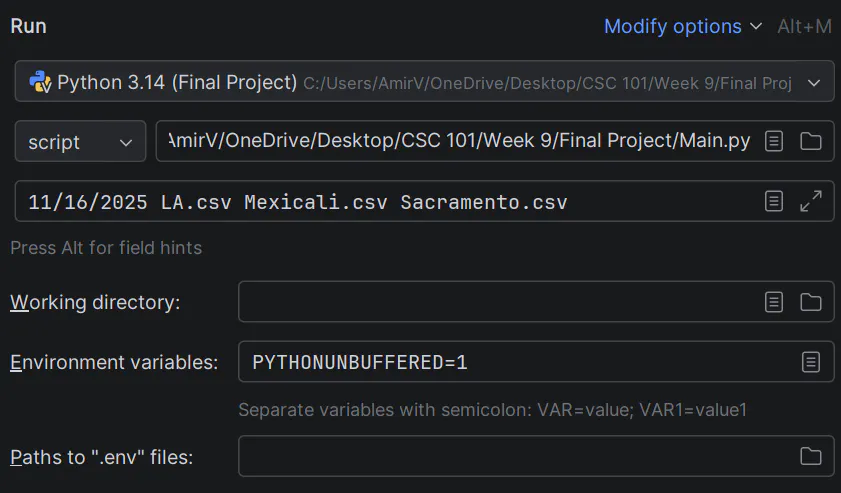
The program is run through command-line arguments (or an IDE run configuration) and includes basic validation so it won’t run unless the inputs make sense.
In our demo:
- Running with no arguments prints an invalid arguments message
- Running with only a date still fails (because it requires at least one CSV)
- Running with a date + one CSV generates a report for that city
- Running with a date + multiple CSVs produces a combined report comparing the cities
Program design (Object-Oriented Approach)
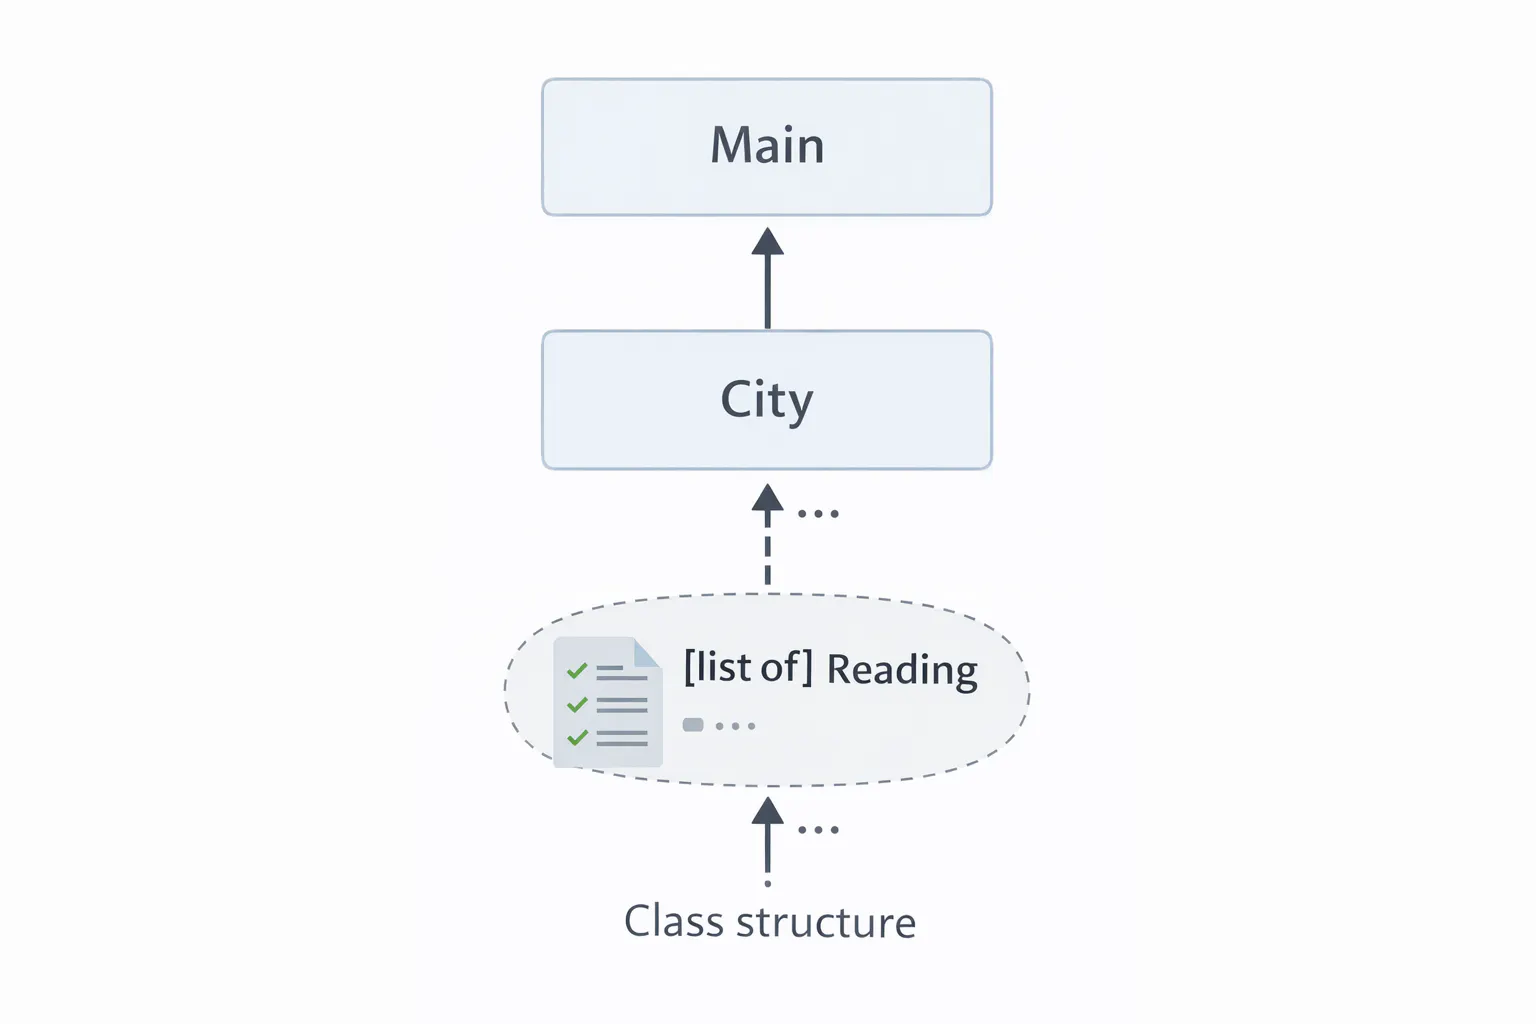
We structured the project around an object-oriented design to keep the code readable and scalable.
Core components:
- Reading: represents one PM2.5 measurement and its timestamp
- City: stores a city’s dataset and computed statistics
When a City object is created, it loads the city’s CSV data and performs the calculations so the object is immediately ready to generate a formatted summary.
What we compute
For each city, the report includes:
- Monthly average
- Weekly average
- Daily average
- Highest recorded value + timestamp
- Lowest recorded value + timestamp
- Days exceeding health standards
Health standard used:
WHO Standards: 5.0 µg/m³
EPA Standards: 9.0 µg/m³
EPA 24hr Standards: 35.0 µg/m³
Testing & reliability
To confirm the analysis stayed correct as the program evolved, we used unit tests with test-case CSV files. This helped verify:
- CSV parsing is correct
- Average calculations and min/max detection are correct
- Output formatting stays consistent
Why it matters
PM2.5 is linked to respiratory health risks, but raw measurement data can be hard to interpret. This project converts many individual readings into an understandable summary so people can more easily compare air quality across major cities and time ranges.
What I learned
This project reinforced:
- Designing a clean class model around real datasets
- Building a pipeline from raw input → structured objects → analysis → report output
- Defensive programming (argument validation + error handling)
- Using unit tests to keep logic stable while iterating
Future improvements
If we expanded this project, I’d like to add:
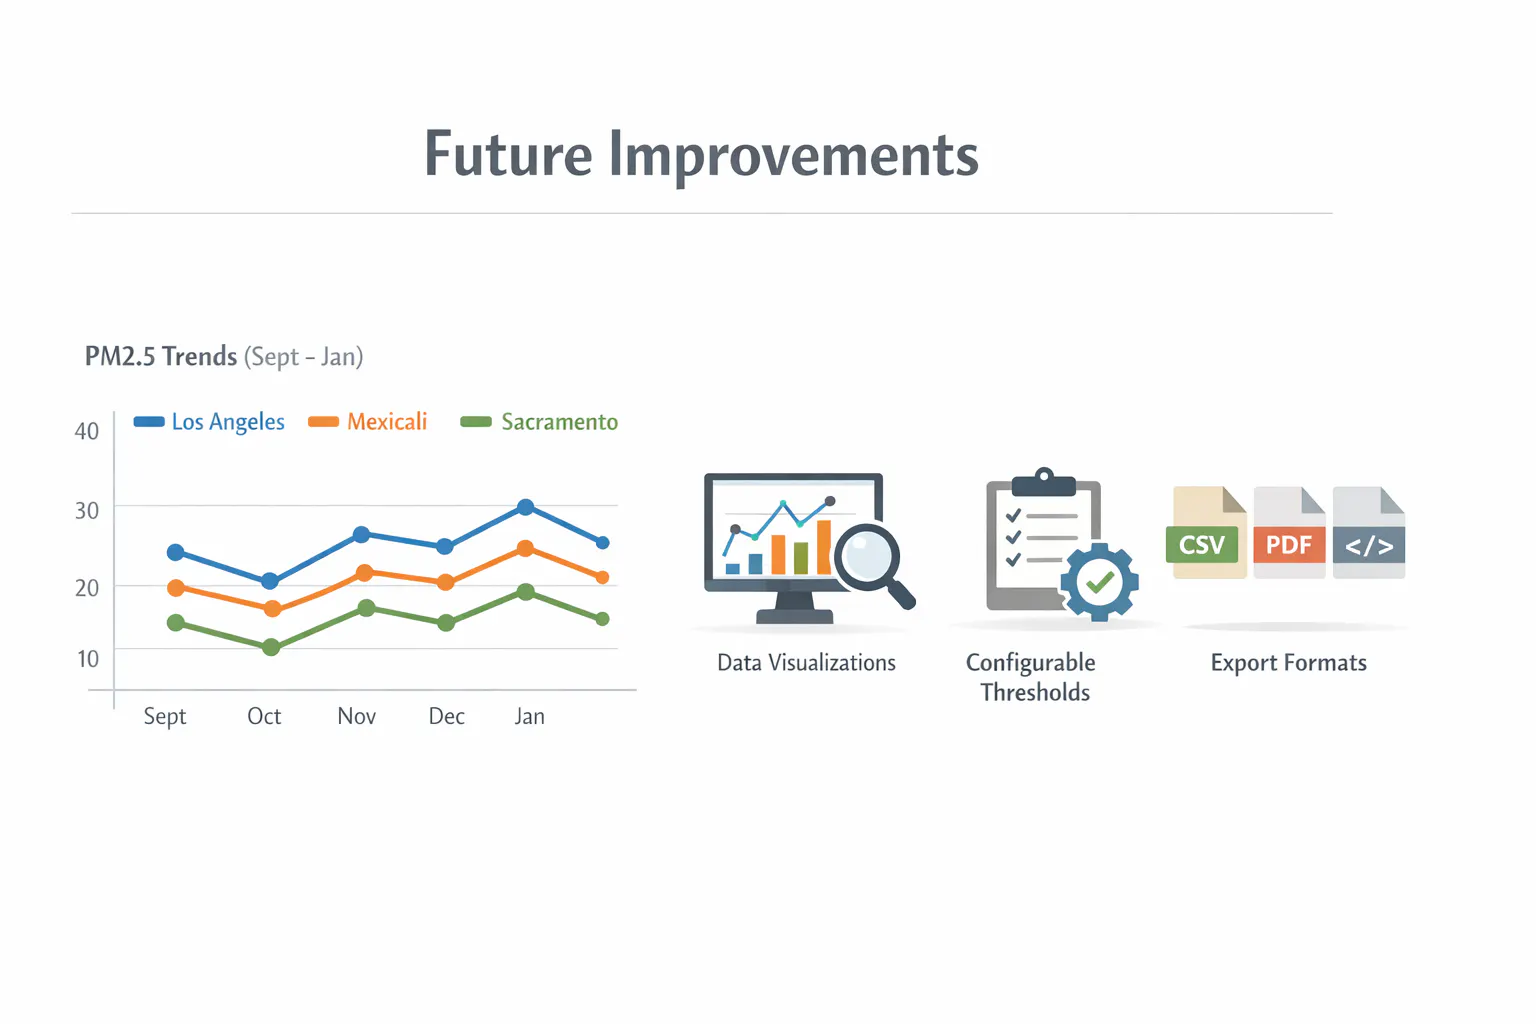
- Visualizations (trend lines, comparisons, distributions)
- Configurable health standards (switch between WHO/EPA thresholds)
- More cities and automated dataset ingestion
- Export formats beyond .txt (CSV summary, PDF, or HTML report)